
|
The diffraction patterns for all compounds of the database of crystal structures of intermetallic and inorganic compounds were processed using above algorithms. A DataBase of diffraction images (about 28,000 units of information) was formed, which is included in the program for qualitative phase analysis at the software level . (more details).
|
|
The equation for calculating the integrated intensity of diffraction reflections is as follows:
where I(hkl) is the integral intensity of a reflection hkl; К is the proportional coefficient; F(hkl) – structural amplitude of a reflection hkl; Lp– product of the Lorentz and polarization factors (Eq. (2) for polycrystals), q – the Bragg’s angle); P – multiplisity; A – absorption factor (for reflection mode use a formula A = 1-exp(-2mR/sinq) , R – sample thickness, m – linear absorption coefficient); e – extinction factor; T – texture multiplier (more details). The structural amplitude in general form (without taking into account the symmetry elements of a specific space group) can be calculated by the equation:
where fi is the atomic scattering factor of the i-atom (taking into account thermal vibrations (4)), B is the isotropic temperature factor, l is the wavelength of X-ray radiation); xj, yj, zj are the coordinates of the i-atom; n is the number of atoms in the i-position; N is the number of point positions occupied by atoms in the structure; gi is the coefficient of filling the i-position with atoms (gi £ 1).
Thus, with the information available on the crystal structure of the compound in the DataBase (more details) and the appropriate software, it is possible to calculate: interplanar distances dhkl according to the general quadratic formula:
where
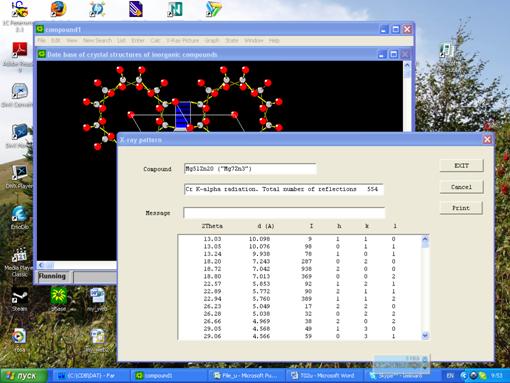
and at a certain radiation, the integral reflection intensities I(hkl) according to Eq. (1). Since the integral intensities of diffraction reflections significantly depend on the wavelength of the radiation (the relationship between the radiation angle and the wavelength The diffraction pattern of a certain compound can also be presented in the form of a table with following parameters calculated for each reflection: 2q angle, d(A) interplanar distance, I intensity (1000-point scale), h, k, l plane indices (Fig. 1). |













|
Fig. 1. Screenshot of the diffraction pattern processing for Mg7Zn3 compound on chromium radiation |
|
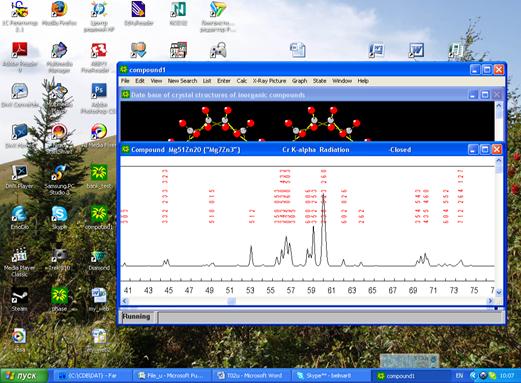
In addition to the analytical representation of the diffraction pattern of each compound, this diffraction pattern can also be obtained in a graphical mode (Fig. 2). The values of the integral intensities of the reflections of the compound selected, as well as the angular positions of its peaks on a certain X-ray radiation, are used to calculate the envelope curve of the sum of all available peaks. In this case, the Lorentz distribution was assumed for the peak profile of a separate reflection (a1– and a2 -components).
|
|
|
|
Fig. 2. Screenshot of a fragment of the diffraction pattern of Mg7Zn3 compound on chromium radiation |


|
|