Ïîäïèñü: Ïîäïèñü: The primary processing of diffraction data (determination of the position of the center of gravity of the Êa1  peak and its integral intensity) was performed by full-profile analysis. We have implemented a software for the primary processing of X-ray diffraction patterns, the main computational module of which was developed by Pecharsky V.K., Zavaliy P.Yu. and Axelrud L.G. This software provides the interpolation of experimental diffraction maxima by mathematical fitting curves (Lorentzian), and determines the positions of the centers of gravity of the peaks, their integral intensities and half-widths. Due to the correct mathematical processing of the experimental profile of the diffraction reflection (fragment of the diffraction pattern), the positions of the centers of gravity of the peaks are  determined  with an  error of   ±(0.001 – 0.005°), and the integral intensities – with an error of ±(5 – 15%). 
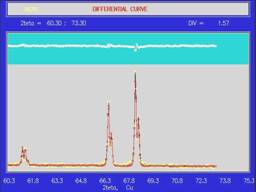
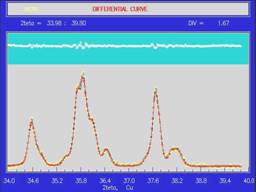
The graphical results of processing for fragments of two diffraction pattrns: diffraction pattern without  Ka1/Ka2 doublet separation  (Fig. 1a)  and diffraction pattern  with Ka1/Ka2 doublet separation (Fig. 1b) are depicted below. ).

Processing of Initial X-Ray Diffraction Data

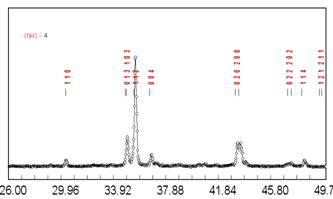
Diffraction patterns of polycrystalline samples (powders or sections) are collected with an X-ray apparatus DRON-3M in  filtered copper radiation  (30 kV of anode voltage, 20 mA of current, 2 and 4 mm entrance slits, 0.1 mm detector slit) in a discrete mode. Depending on the chemical composition of the sample and the purpose of its study, the scanning step range is 0,010-0,050, the exposure time at each point is changing from 2 to 20 s, the angular recording interval is from 80 äî 1500. The  sample is rotating in the plane of a vertically fixed cuvette with the substance studied. Typical diffraction pattern are presented below.


Return

.


Fig. 1 Fragment of a typical diffraction pattern obtained in a discrete mode

                                          a                                                             b

Fig. 2. Result of application of the profile analysis of fragments of diffraction pattern for YCuGa2 (a) and Al2O3 (b) compounds.

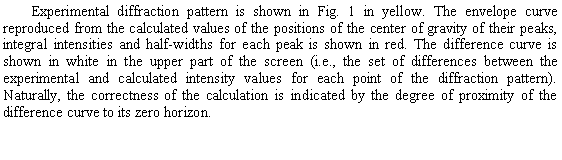
Ïîäïèñü: Experimental diffraction pattern is shown in Fig. 1 in yellow. The envelope curve reproduced from the calculated values ​​of the positions of the center of gravity of their peaks, integral intensities and half-widths for each peak is shown in red. The difference curve is shown in white in the upper part of the screen (i.e., the set of differences between the experimental and calculated intensity values ​​for each point of the diffraction pattern). Naturally, the correctness of the calculation is indicated by the degree of proximity of the difference curve to its zero horizon. 

Ïîäïèñü: