|
X-ray diffraction phase analysis for each of the samples studied is carried out using a special set of programs using a DataBase of reference diffraction patterns (more details), which are processed using literature data on the crystal structure of intermetallic and inorganic compounds (oxides, halides, chalcogenides, etc.), applying the PDF-2 DataBase, as well as a working DataBase of diffraction patterns, which contains information about compounds synthesized by us for the first time. . The phase analysis program provides the possibility of graphical comparison of the experimental diffraction pattern of the sample studied with the diffraction pattern of the standard; analytical comparison of the interplane distances of the sample and the standard. Lattice parameters of each phase component for which identification is carried out are specified by the least squares method. The error of adjusting the working surface of the sample on the diffractometer is also specified analytically. The relative uncertainty in determining the parameters of crystal lattice of the phase components does not exceed 0.03% A resulting envelope as a sum of the envelopes of all diffractogram’s peaks is obtained from the integral intensities of the standard reflections for compounds that are phase components of the sample, from the refined values of the angular positions of peaks at the given radiation (determined by the refined least squares values of the lattice periods) and from the experimental values of the half-widths of the reflections from the sample studied. In this case, the Lorentz distribution of the peak profile was assumed for a separate reflection (a1– and a2 -components) ,
where I(hkl) is the integral intensity of the reflection hkl; ds is the half-width of the corresponding reflection of the sample ; x, y are the current coordinates of the graphic image .
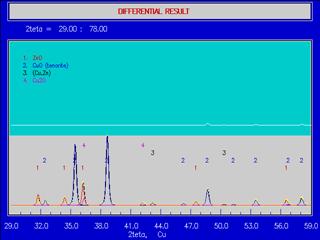
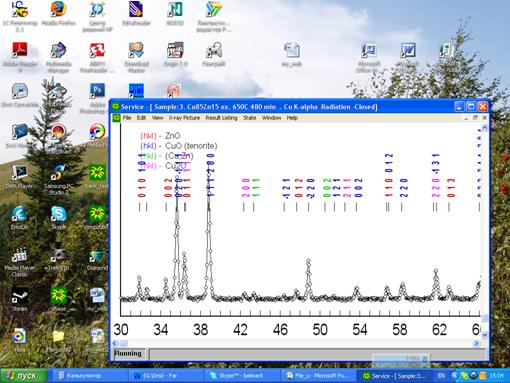
Using the intensities of diffraction reflections of the standards allows to “extract” graphically and analytically the diffraction peaks of each identified phase component from the experimental diffraction patterns of samples, which as a result allows obtaining the spectrum-residue. The correctness criterion for the phase analysis is the background spectrum-residue, where the intensity of possible diffraction reflections merges with the background level within the uncertainty range (Fig. 1). Results of the phase analysis performed for each sample are implemented in a graphical form (Fig. 2) and in a corresponding records sheet (Fig. 3) .
|

Qualitative Phase Analysis |
|
Fig. 1 Fragment of a graphical representation of the correctness the phase analysis of a four-phase sample—solid solution powder (Cu,Zn) oxidized at 650°C |
|
Applying the DataBase of structural characteristics of intermetallics and inorganic substances (oxides, chalcogenides, halides) created and the software developed allows us to calculate reference diffraction patterns (if necessary, taking into account the texture of any direction and degree, as well as corrections for the thickness of thin coatings and films). The use of such reference spectra provides correctly a qualitative phase analysis of any polycrystalline substances .
|
|
|
|
Fig. 2 Screenshot of a graphical representation of a fragment of the result of phase analysis of a four-phase sample—solid solution powder (Cu,Zn) oxidized at 650°C |
|
Fig. 3 Final record of the result of phase analysis of a four-phase sample—solid solution powder (Cu,Zn) oxidized at 650°C |


|
|

|
|