Quantitative Phase Analysis |
|
The method developed and implemented by us for determining the quantitative content of phases in a mixture (up to six phase components) is based on a mathematical algorithm for its refinement simultaneous with the refinement of the parameters of the crystal structure (atomic coordinates, atomic filling coefficients of the corresponding positions, temperature factors, texture) of each phase. The reflection intensity of each single phase in a mixture can be represented as:
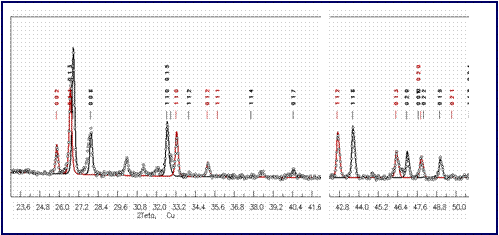
where for each phase: I(hkl)I is the reflection intensity from hkl plane ; ci is the volume concentration; Qi is the scattering ability per unit volume ; mi is the linear absorption coefficient; di is the average particle size of the i-phase component ; The scattering ability of the i-th phase of the mixture, in turn, is calculated as: Qi = where I(hkl)i0 is the scattering intensity; Vi is the volume of the unit cell of the i-phase component . The set of programs for quantitative phase analysis developed has been tested on many standard mixtures (samples with known quantitative phase composition). If the texture in the sample is insignificant, the average particle size is small (up to 1 mm), or the values of linear coefficients are close ( Fig. 1 illustrates the result of determining the quantitative ratio of sulfofluoride phases in the synthesis product of dysprosium sulfofluoride: Dy3S2F4 (Yb3S2F4 -type structure, calculated content of 56 wt. %) and DySF (PbFCl-type structure, calculated content of 44 wt. %), RI = 0.074.
|



|
Fig.1 Graphical result of quantitative phase analysis (circles – experimental values of intensities, solid black and red lines – processed)
|


|
|